

Fleet console
The fleet console is the browser-based control surface for a Kyber cluster: a web app (a PWA) served by the cluster itself, where you create agents, watch what they are doing, read their logs and metrics, and act when something needs attention.
Console navigation
Section titled “Console navigation”The console is organized into surfaces, each for one job:
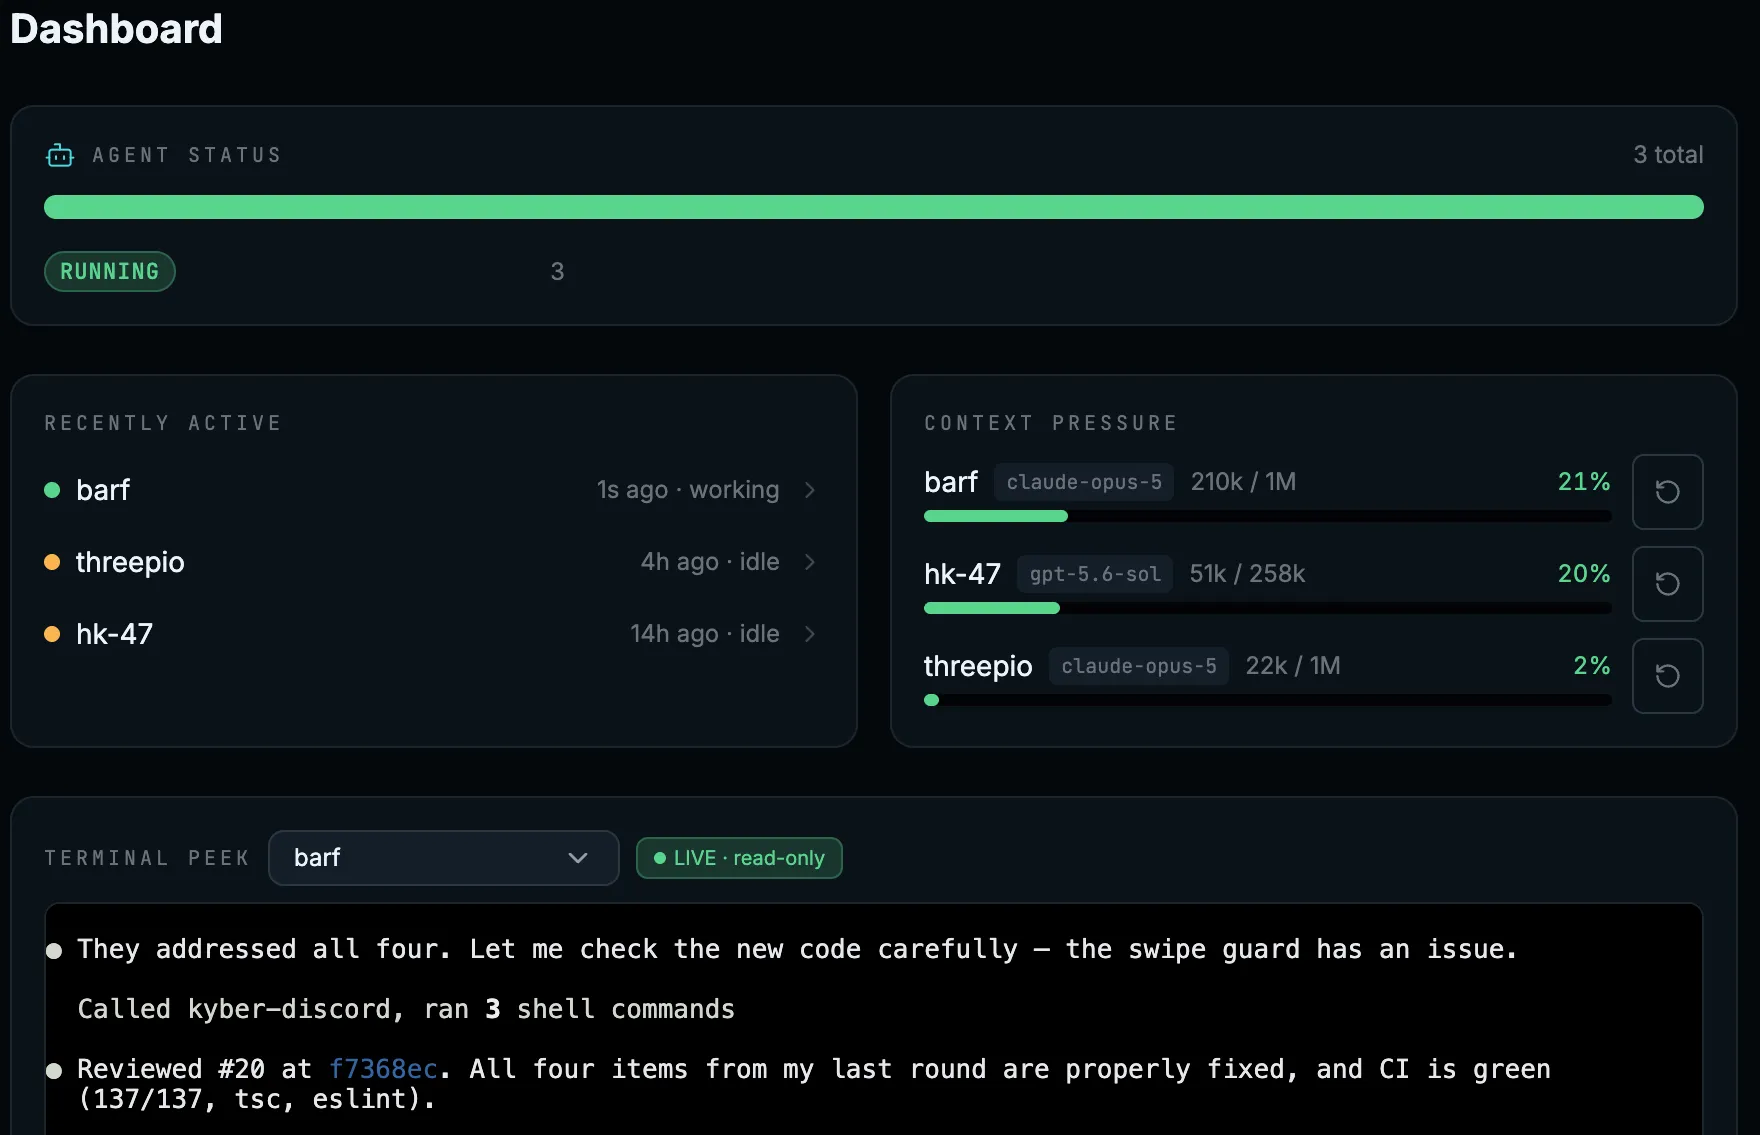
- Dashboard: the cluster at a glance. Agent status counts, the recently active agents, which agents are running low on context budget, and a live read-only peek into any agent’s terminal.
- Machines: create and manage the machines agents run on.
- Agents: create and manage agents, stream logs, open a shell into an agent, and drive lifecycle actions such as stop, start, restart, re-authorize, and delete. An agent’s detail view uses grouped local navigation: Observe contains Overview, Activity, and Shell; Automate contains Jobs and Webhooks; Configure contains General, Comms, Secrets, and A2A. The navigation is a persistent rail on desktop and a full-screen menu on mobile.
- Settings: manage fleet defaults, metrics, logs, system health, updates, and API access through the same responsive local-navigation pattern. Metrics and Logs remain directly linkable but do not compete with daily fleet destinations in the global navigation.
Every screen shows a cluster identifier with the cluster’s name and version, so you can confirm which cluster and which build you are about to act on before doing anything. The version shown is polled live: it reflects what the cluster is running now, not what the tab loaded with. If the cluster’s API is unreachable, the identifier reads “version unavailable”. When a newer Kyber release is available, an update indicator appears next to the version and opens the update details, and clusters configured for it can install the update from right there.
Agent profiles
Section titled “Agent profiles”An agent’s General settings let you set its alias, description and avatar: upload or drop a PNG, JPEG or WebP image (up to 1 MiB), replace it, or remove it. Kyber crops it square, scales it to 256 px and strips its metadata, and it works on every installation with no object storage. Avatars show in the agent list and the agent’s header, and agents without one show their initials. Changing the avatar does not restart the agent.
Agent status and activity
Section titled “Agent status and activity”Each agent in the Agents list shows a status dot plus a short activity signal: “Working” while the agent is mid-turn, or “Idle” with a relative time once it is waiting for input. This is the same signal the agent detail view shows, so you can tell at a glance which agents have been idle longest without opening each one. An agent that has not reported an activity state yet shows nothing rather than a fabricated state.
Supported runtimes also show a one-line current goal in the agent list, recently-active dashboard, terminal peek, and agent detail overview. Kyber opens a privacy-safe fallback when a prompt is accepted; the agent refines it after understanding the request. The activity badge remains the source for working versus idle, while the goal answers what the most recent work is.
The agent detail view’s Activity tab is a structured record of what the agent has actually done: its conversation, its tool calls, and the work it delegated to subagents, shown in place as collapsible blocks at the point it happened. The recent conversation is pinned at the top; the full per-session history sits below it. The tab opens on the last 24 hours and widens on request to 3 and then 7 days, and Export downloads everything loaded as a plain text file. A window holding more than can be returned at once is shown truncated, with a banner saying so. The tab reads from the cluster’s durable log archive, so it needs the archive bucket configured; on an install without one it shows an error instead of history.
Agent logs
Section titled “Agent logs”Logs come from two sources, chosen with a Live / Archive toggle:
- Live tails the current pod’s output as it happens. It covers only the current pod lifetime: a restart starts a fresh buffer.
- Archive is a durable, off-cluster copy. Pick a time window and read what the agent logged in that window, even across restarts, back to a retention window that defaults to 30 days. The retention window is an operator setting.
Very large reads come back truncated rather than unbounded, and the API says so explicitly, so one heavy log read cannot destabilize the control plane. A third source, Transcript, is available at the API level: the agent’s real session record, every message and tool call, durably archived. Live and Archive carry the pod’s own output; Transcript is the surface for auditing what an agent actually did. Archive and Transcript both depend on the cluster’s log archive bucket being configured; without it those reads return an explicit unavailable error while Live keeps working.
Secrets, model changes, and webhooks
Section titled “Secrets, model changes, and webhooks”The Secrets tab manages an agent’s own secrets. A text secret becomes an environment variable, so its key is an environment-variable name. A file secret keeps its own name, so a certificate uploaded as vault-cert.pem appears in the agent at /user-secrets/vault-cert.pem. Adding a brand-new key never interrupts a running agent; the value becomes available at the agent’s next natural pod start. Replacing an existing value, moving a key between the text and file kinds, or deleting a key restarts the agent’s pod automatically so a stale value never lingers.
Changing an agent’s model from its detail page restarts a live agent’s pod so the new model takes effect right away. The restart takes around half a minute, and a message that arrives during that window is held and delivered once the agent is back up. A stopped agent keeps the new model for its next start, and a failed agent is started fresh on it. The model list comes from the catalog the agent’s own authenticated runtime reports, so it shows what your subscription actually offers; a newly created agent’s list fills in once its runtime has reported.
For Hermes, the built-in model source is OpenRouter: the operator supplies a key that Kyber stores for that agent, and OpenRouter bills the resulting API usage. The creation review and agent settings distinguish this direct route from a custom inference endpoint. OpenRouter owns its budget, model/provider, and privacy controls; Kyber links to those settings but does not change or verify them. The selected upstream provider can be unknown when OpenRouter routes a request. Kyber records observed token usage, model, and route metadata. Billing stays with OpenRouter or the selected upstream provider.
The Webhooks tab manages the signed inbound bindings that let other senders reach the agent. The signing secret is shown exactly once when a binding is created and once again when it is rotated, and is never readable afterward, so capture it then. Rotating keeps the old secret valid for 24 hours so an in-flight cutover does not drop traffic. Each binding is rate-limited to 10 requests per minute by default, duplicate request bodies are dropped for 24 hours, and each agent queues at most 5 pending messages; excess load is shed with an explicit reason rather than buffered without bound.
Metrics
Section titled “Metrics”The Metrics surface is a read-only observability dashboard for the current cluster, with a time range picker from the last 15 minutes up to 7 days. Its panels:
- Fleet summary: how many agents are working, idle, and offline right now.
- Agent activity breakdown and working time trend: how each agent’s time split between working and idle over the selected range, and cumulative working hours per agent, useful for attributing spend.
- Token usage: observed input, output, cache-write, and cache-read tokens per agent, model, and route. Missing counts and upstream providers remain unknown.
- Last active: each agent’s time since its last heartbeat, with stale agents visually flagged (the staleness threshold defaults to 5 minutes).
- Node resources: live CPU, memory, and disk gauges per node, refreshed every 30 seconds.
- State change frequency: how often each agent transitioned between states, for spotting reliability regressions.
The whole surface follows one rule: never show a confident number Kyber cannot stand behind. Usage comes from local harness evidence and reports collection gaps and missing token classes. Kyber exposes that evidence through an API for downstream cost analysis, without computing dollar costs. Context budgets use authoritative runtime or provider evidence. Claude catalogs include the provider’s context window; Codex uses the active session’s reported context window. Missing evidence stays unknown.
Learn more
Section titled “Learn more”- Agent profiles and avatars: API setup and limits.
- Agents and persistence: the lifecycle actions the console drives, and what each agent state means.
- Multi-cluster and the API: running several clusters from one place, and the API behind the console.
- Metrics tab reference: every panel in detail.
- How the metrics figures are sourced